
The Massachusetts Division of Insurance recently released its 2023 Annual Home Insurance Report, providing a comprehensive retrospective of what proved to be a pivotal year for the Commonwealth’s insurance landscape. This data confirms many of the market trends we’ve observed materializing over the past two years for the Massachusetts Property and Casualty space. This article will highlight the specifics of this report and what the report reveals about the recent homeowners’ insurance market in Massachusetts. Please note all graphs and charts are reprinted from the Report, courtesy of the Massachusetts Division of Insurance.
Market Composition: Regional Carriers Maintain Strong Presence
Massachusetts homeowners collectively paid approximately $3.4 billion in home insurance premiums during 2023, representing a substantial 17.9% increase from 2022 levels. This premium growth occurred despite a slight decrease in total policies (down 0.33% or 7,041 policies) – with owners’ policies increasing by 19,294 while tenant and condominium policies decreased by 26,335.
The market remained characterized by a strong regional carrier presence in 2023. MAPFRE Insurance Group (parent of Commerce Insurance) maintained the largest market share at 12.5% of the voluntary market. The next largest carriers included Liberty Mutual (9.2%), Safety Group (6.5%), and the Andover Group (6.5%).
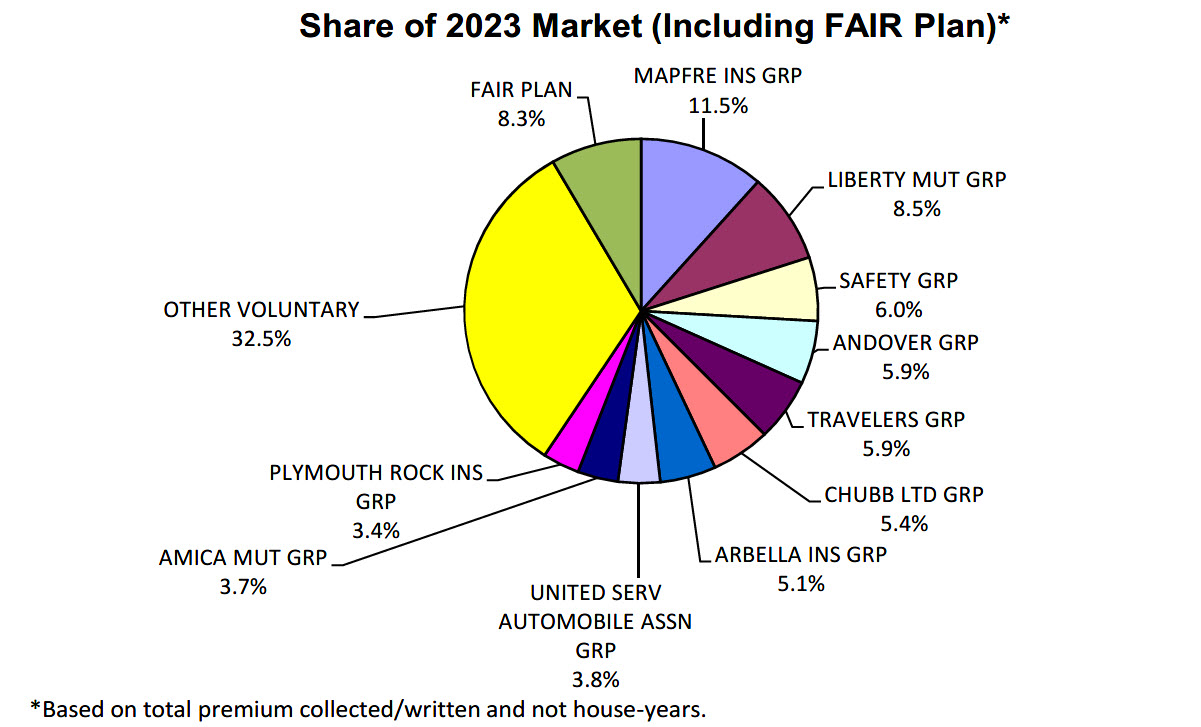
Among the top 10 home insurance groups, only five offered coverage nationally (Travelers, Liberty Mutual, Chubb, Amica, and USAA), while the remaining leaders were regional companies focused primarily on the Northeast. The top 25 insurers collectively accounted for 91.7% of the non-FAIR-Plan Massachusetts market, while the remaining 44 groups and four individual companies wrote 7.8% of the market.
FAIR Plan: Enrollment Decreases, Financial Performance Improves
The Massachusetts FAIR Plan, serving as the residual market since 1968, showed signs of stabilization in 2023. The Plan’s policy count decreased by 3,197 policies between fiscal years 2022 and 2023, representing 8.3% of written premium in the market – a significant improvement from its peak market share of 16.1% in 2007.
Regional disparities in FAIR Plan reliance remained pronounced. While the FAIR Plan wrote under 10% of policies in most counties, it still provided 33.0% of home insurance policies in the Cape and Islands region (Barnstable, Dukes, and Nantucket counties).
Financially, the FAIR Plan posted an underwriting loss of $129 per policy in fiscal year 2023, an improvement from the $177 per policy loss in 2022. It’s worth noting that the FAIR Plan had not filed to revise its rates since 2013 when it requested a 6.8% increase that was ultimately disapproved in 2014.
Claims Activity: Significant Increases in Frequency and Severity
Claims activity increased dramatically in 2023, with insureds filing 86,330 claims – a striking 67.6% increase from 2022. Eight catastrophic events resulted in approximately $892.3 million in property losses during the year, compared to $208.3 million of catastrophe losses in 2022.
Water damage and freezing (non-flood related) accounted for the majority (54.0%) of total claims submitted. However, when examining the dollar value of claims:
- Fire, lightning, and removal: 29.0% of total losses (down from 39.2% in 2022)
- Non-flood water damage and freezing: 46.5% of losses (up from 40.3% in 2022)
- Wind and hail: 12.2% of losses (up from 7.4% in 2022)
- Liability and medical payments: 3.9% of losses (down from 4.6% in 2022)
- Theft: 0.5% of losses (down from 0.7% in 2022)
- All other: 8.0% of losses (up from 7.8% in 2022)
The average claim size varied significantly by cause of loss. Fire claims averaged $63,155 (down from $103,864 in 2022), wind claims averaged $11,549 (up from $10,282 in 2022), and water damage claims averaged $16,206 (down from $18,885 in 2022).
Loss Ratios and Financial Performance
The overall loss ratio for the market was 51.2% in 2023, up from 42.2% in 2022. By policy form:
- Traditional homeowners policies: 51.3% loss ratio
- Condominium coverage: 60.4% loss ratio
- Tenant coverage: 27.5% loss ratio
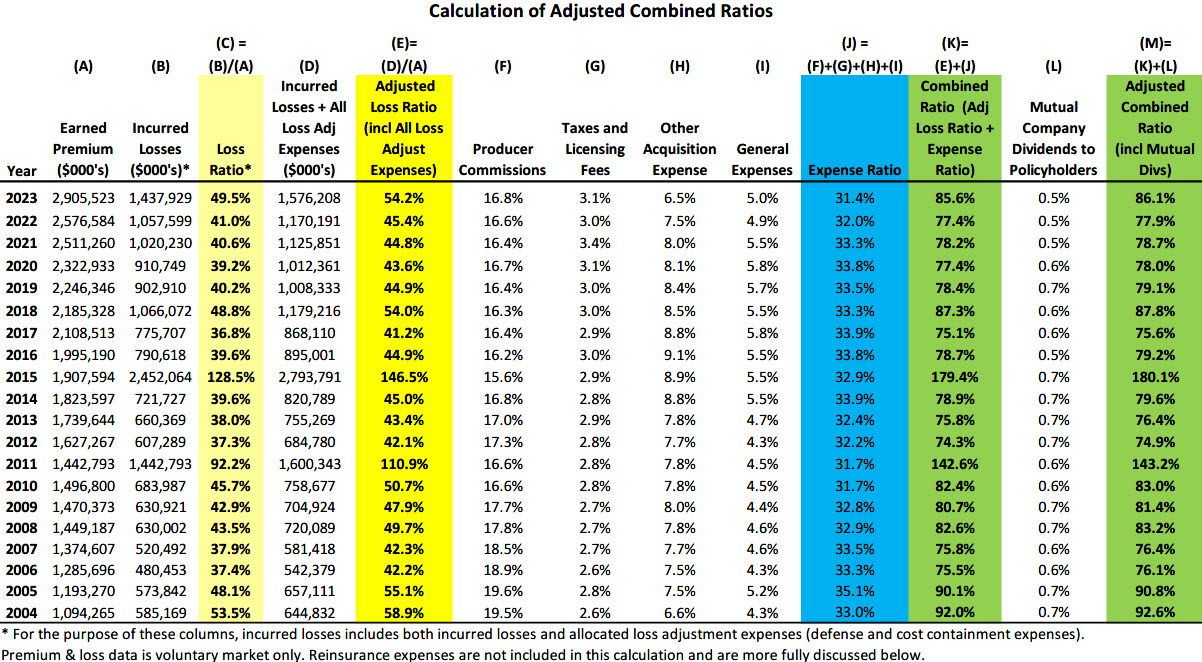
The adjusted combined ratio (which includes expenses and dividends) increased to 86.1% in 2023 from 77.9% in 2022. The expense ratio component remained relatively stable at 31.4% (compared to 32.0% in 2022), while mutual company dividends to policyholders remained consistent at 0.5%.
The Adjusted Combined Ratio Chart from the 2023 Annual Homeowners Report
Coastal and Urban Market Dynamics
The DOI continued monitoring policy availability in “designated” zip codes (both coastal and urban areas) that have historically had availability concerns. In 2023, the top 25 companies and the FAIR Plan reported:
- 582,200 policies in force in urban and coastal areas as of December 31, 2023 (381,426 in urban areas, 200,465 in coastal areas)
- 95,847 policies canceled (78,305 by insurance companies, 17,542 by FAIR Plan)
- 72,919 cancellations in urban areas and 22,928 in coastal areas
- 65,011 cancellations were policyholder-initiated; 30,836 were insurer-initiated
Of the insurer-initiated cancellations:
- 3,447 occurred within the first 60 days of coverage
- 25,144 were due to nonpayment
- 2,245 were for other reasons permitted by law
Regarding nonrenewals, there were 9,248 policies nonrenewed in designated zip codes (7,526 by the top 25 companies, 1,722 by the FAIR Plan). Three companies – Heritage Insurance Holdings Group, American International Group, and Barnstable Group – had the highest nonrenewal percentages in 2023.
Claims History and Nonrenewal Correlation
The report reveals a clear correlation between claims history and nonrenewal decisions. Of the 456,219 urban or coastal policies renewed by the top 25 companies, there were approximately 27,918 claims filed (61 claims per 1,000 policies) with an average claim size of $13,330.
In contrast, the 7,069 nonrenewed policies had 1,832 claims (259 claims per 1,000 policies) with an average claim size of $22,121.
When comparing urban and coastal areas:
- Urban renewed policies: 55 claims per 1,000 policies, average claim size $12,669
- Urban nonrenewed policies: 186 claims per 1,000 policies, average claim size $31,404
- Coastal renewed policies: 77 claims per 1,000 policies, average claim size $14,477
- Coastal nonrenewed policies: 351 claims per 1,000 policies, average claim size $16,000
Despite this correlation, the vast majority of policyholders with claims histories were still renewed – 96.8% in urban areas and 91.9% in coastal areas.
Wind Deductibles: Prevalent in Coastal Areas
Wind deductibles remained a prominent feature in 2023, particularly in coastal areas. Of all policyholders in coastal areas, 60.0% had mandatory wind deductibles, compared to just 19.9% in urban areas. Overall, 33.6% of policyholders in coastal or urban areas covered by the top 25 companies or the FAIR Plan had a mandatory wind deductible.
All but six of the top 25 companies reported using mandatory wind deductibles, with deductibles reaching up to 5% of dwelling coverage value in the coastal parts of Bristol, Plymouth, Barnstable, Dukes, and Nantucket counties.
The DOI continued encouraging insurers to allow mitigation measures to reduce or eliminate these deductibles, with some companies establishing clear programs for mitigation credits.
Climate Mitigation Efforts
The industry’s focus on climate risk mitigation gained significant traction in 2023. The DOI surveyed the top 25 insurers and the FAIR Plan on climate resilience initiatives, finding:
- 18 companies offered premium credits or reduced rates for certain loss mitigation measures
- Six reduced or eliminated wind deductibles for mitigation features like hurricane shutters
- Eight insurers reported that considering policyholder mitigation measures increased their capacity to write homeowners insurance in Massachusetts
- 14 companies reported using community-level resilience data from sources like commercial catastrophe models and ISO’s Building Code Effectiveness Grading (BCEG)
- One insurer provided premium credits for LEED (Leadership in Energy and Environmental Design) certified homes
The NAIC Climate and Resiliency Task Force made significant progress in 2023, including:
- Adoption of a revised Climate Risk Disclosure Survey aligned with international standards
- Updates to the Risk-Based Capital formula to include specific charges for hurricane, earthquake, and wildfire risks
- Creation of a Catastrophe Modeling Center of Excellence to better understand how climate risk is incorporated into models
Flood Insurance: Coverage Gap Persists
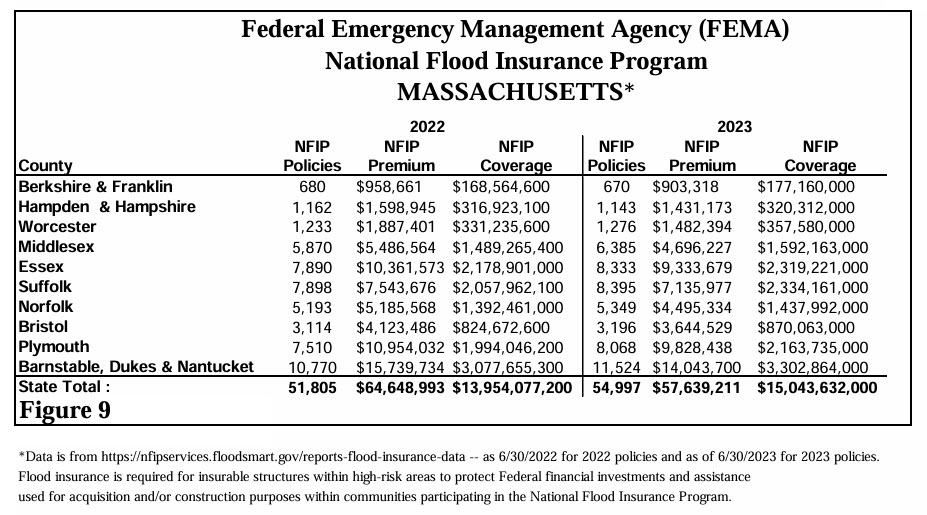
Despite increasing flood risks, flood insurance take-up rates remained low in 2023. FEMA reported 54,997 flood policies in Massachusetts in 2023, an increase of 6.2% from 51,805 in 2022. However, this represented only a small fraction of insured properties:
- Barnstable, Dukes, and Nantucket counties: 8.9% of homes had flood insurance
- Plymouth County: 4.9% of homes had flood insurance
- Essex County: 3.5% of homes had flood insurance
- Suffolk County: 3.4% of homes had flood insurance
- All other counties: under 2.5% of homes had flood insurance
FEMA’s Risk Rating 2.0, effective for new policies in October 2021 and renewal policies in April 2022, was fully operational throughout 2023. This methodology incorporated more flood risk variables, including flood frequency, multiple flood types, distance to water sources, and property characteristics.
The private flood insurance market showed growth, with private flood coverage increasing to $8,705,496 in direct written premium on 4,558 residential flood policies (year-end 2023), plus $1,792,571 in direct written premium on 2,307 private residential endorsements.
Premium Trends by Policy Type
Average premiums increased across all policy types in 2023:
- Traditional homeowners: $2,054 (up from $1,818 in 2022)
- Condominium: $530 (up from $473 in 2022)
- Tenant: $181 (up from $176 in 2022)
- Traditional homeowners: $3.26 billion (up from $2.76 billion in 2022)
- Condominium: $74.3 million (up from $69.4 million in 2022)
- Tenant: $76.6 million (up from $160.4 million in 2022)
Market Distribution by County
The report provides detailed insights into policy distribution across Massachusetts counties:
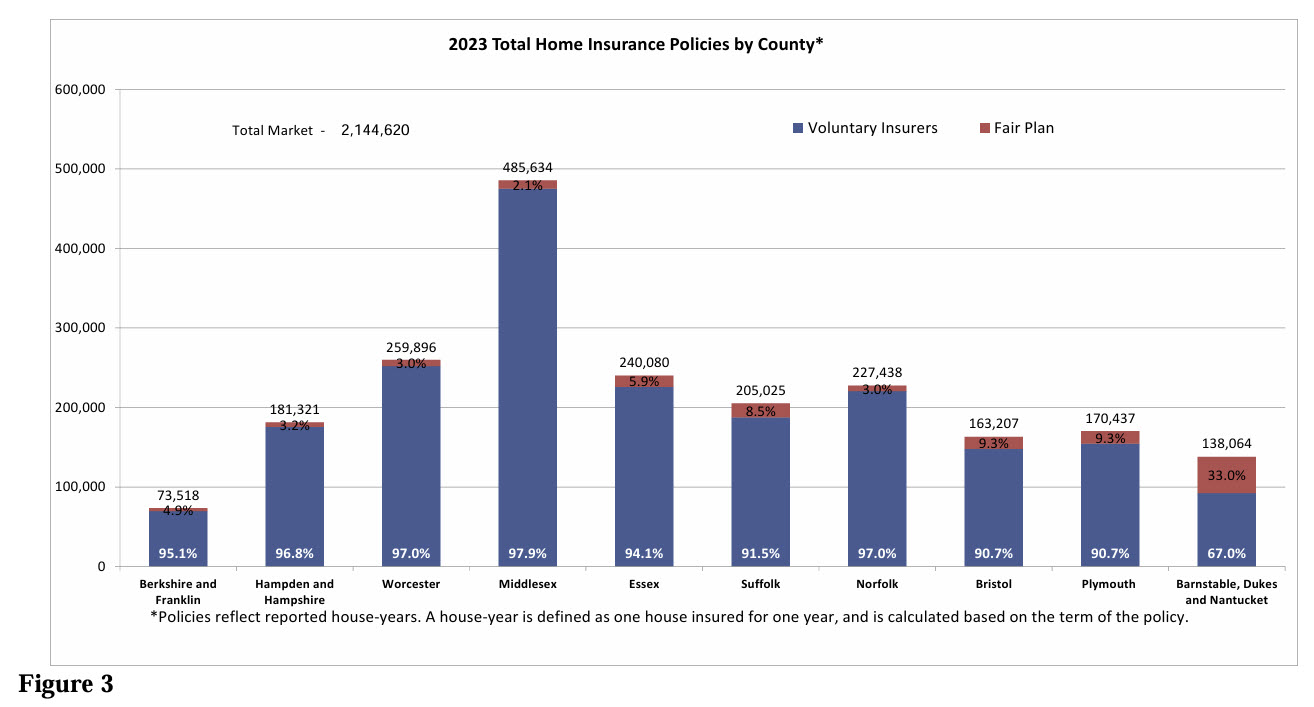
- Middlesex County had the highest number of home insurance policies in force (485,634), followed by Worcester (259,896), Essex (240,080), and Norfolk (227,438) counties
- Between 2022 and 2023, the number of home insurance policies remained fairly consistent in most counties
- The voluntary market maintained high market shares in most counties: 97.9% in Middlesex, 97.0% in Worcester, 94.1% in Essex, and 97.0% in Norfolk.
- The FAIR Plan’s presence varied significantly by region, from just 2.1% in Middlesex County to 33.0% in Barnstable, Dukes, and Nantucket counties.
FAIR Plan Clearinghouse Initiative
The report mentions the FAIR Plan’s Clearinghouse initiative, implemented in 2018 to help insurance companies work with producers to give more FAIR Plan policyholders opportunities to find coverage in the voluntary market. This depopulation initiative allows participating carriers to access non-personally identifiable information about FAIR Plan policies to identify potential voluntary market opportunities.
Looking Back from 2025
Looking back at 2023 from our current perspective 2025, we can now see that year represented a significant transition point for the Massachusetts home insurance market. The substantial increase in catastrophe losses, rising claim severity, and growing emphasis on climate risk mitigation foreshadowed many of the market adjustments that have occurred since then.
The data in this report provides valuable context for understanding the current market conditions and offers a benchmark against which to measure the subsequent evolution of our unique Massachusetts insurance landscape.
For insurance professionals serving Massachusetts property owners, this historical perspective offers valuable insights into the underlying factors that have shaped today’s market realities—and may provide clues to the challenges and opportunities that lie ahead.
Free Copy of the Complete Report
For your own copy of the report, Click on this link to the Division of Insurance website: “2023 Annual Homeowners Report.“
