Safety is the largest Commercial Auto Insurer in MA as of December 2024
Our latest “check-up” on the Commercial Auto Insurance marketplace takes a look at the state of the marketplace in the last month of 2024. As always, the data reviewed for this line of insurance is provided courtesy of the Commonwealth Automobile Reinsurers.
For those readers unfamiliar with the Commonwealth Automobile Reinsurers, “CAR” is the official statistical agent for motor vehicle insurance in the Commonwealth of Massachusetts.
While Safety and Commerce continually vie for the top spot in this line of insurance, as of December 2024, Safety claimed the top spot, albeit by .01%. The following is a list of all the Commercial Auto Insurers in Massachusetts along with their corresponding market share.
According to the latest data from CAR, there are currently 70 insurers active in the Commercial Auto insurance marketplace in Massachusetts. The total premiums for this line of insurance amounted to $1,329,843,529.
Commercial Auto Insurers Ranked by Premiums & Market Share
| Company | Premiums ($) | Market Share (%) | |
|---|---|---|---|
| 1. | SAFETY | 172,132,708 | 12.94 |
| 2. | COMMERCE | 171,955,880 | 12.93 |
| 3. | ARBELLA | 135,999,437 | 10.23 |
| 4. | PROGRESSIVE | 122,549,984 | 9.22 |
| 5. | TRAVELERS | 89,804,094 | 6.75 |
| 6. | PLYMOUTH ROCK | 63,925,483 | 4.81 |
| 7. | FIREMAN’S | 47,706,362 | 3.59 |
| 8. | TOKIO MARINE & NACHIDO | 46,664,869 | 3.51 |
| 9. | SELECTIVE INSURANCE | 34,721,204 | 2.61 |
| 10. | ZURICH | 34,709,918 | 2.61 |
| 11. | HANOVER | 31,877,767 | 2.40 |
| 12. | TWIN CITY FIRE INS | 27,831,470 | 2.09 |
| 13. | LIBERTY MUTUAL INS | 25,511,188 | 1.92 |
| 14. | UTICA | 24,399,654 | 1.83 |
| 15. | MOBILITAS GENERAL INS. | 24,055,599 | 1.81 |
| 16. | OLD REPUBLIC | 23,902,210 | 1.80 |
| 17. | GREAT AMERICAN | 18,047,463 | 1.36 |
| 18. | GREEN MOUNTAIN | 16,123,411 | 1.21 |
| 19. | FEDERATED MUTUAL | 15,686,919 | 1.18 |
| 20. | AMERICAN CASUALTY | 15,314,064 | 1.15 |
| 21. | NEW HAMPSHIRE | 13,003,729 | 0.98 |
| 22. | ARGONAUT | 12,591,419 | 0.95 |
| 23. | NATIONAL GRANGE | 11,586,315 | 0.87 |
| 24. | FEDERAL | 11,369,828 | 0.85 |
| 25. | N&D MUTUAL | 10,381,153 | 0.78 |
| 26. | EMPLOYERS MUTUAL | 10,272,059 | 0.77 |
| 27. | CINCINNATI | 9,834,755 | 0.74 |
| 28. | CENTRAL MUTUAL INS | 9,651,111 | 0.73 |
| 29. | FARM FAMILY | 9,451,351 | 0.71 |
| 30. | IMPERIUM | 8,342,340 | 0.63 |
| 31. | US FIRE | 7,673,686 | 0.58 |
| 32. | MIDDLESEX INS CO | 7,456,822 | 0.56 |
| 33. | NEW YORK AND GENERAL INS | 6,741,712 | 0.51 |
| 34. | ARCH | 6,519,569 | 0.49 |
| 35. | BANKERS | 6,401,355 | 0.48 |
| 36. | MERCH MUTUAL | 5,560,024 | 0.42 |
| 37. | STARR INDEMNITY | 4,094,859 | 0.31 |
| 38. | QUINCY MUTUAL | 3,965,609 | 0.30 |
| 39. | GEICO | 3,815,825 | 0.29 |
| 40. | PREFERRED MUTUAL | 2,703,805 | 0.20 |
| 41. | LANCER INSURANCE CO. | 2,427,571 | 0.18 |
| 42. | MOTORISTS | 2,160,275 | 0.16 |
| 43. | GREENWICH | 1,895,270 | 0.14 |
| 44. | PROTECTIVE | 1,803,503 | 0.14 |
| 45. | HARLEYSVILLE INS | 1,656,200 | 0.12 |
| 46. | EVEREST NATIONAL | 1,639,095 | 0.12 |
| 47. | SECURITY NATIONAL | 1,540,969 | 0.12 |
| 48. | STATE AUTO | 1,406,408 | 0.11 |
| 49. | ATLANTIC SPECIALTY | 1,338,171 | 0.10 |
| 50. | CHURCH MUTUAL | 1,313,539 | 0.10 |
| 51. | PRIME PROPERTY & CASUALTY | 1,112,888 | 0.08 |
| 52. | PENN MNFCT ASSC INS | 1,046,455 | 0.08 |
| 53. | BERKSHIRE HATHAWAY | 1,040,087 | 0.08 |
| 54. | PENN LUMBERMENS | 900,771 | 0.07 |
| 55. | SOMPO AMERICA | 819,246 | 0.06 |
| 56. | AXIS REINSURANCE | 587,879 | 0.04 |
| 57. | AMERICAN AUTOMOBILE | 547,627 | 0.04 |
| 58. | QBE | 469,778 | 0.04 |
| 59. | FALLS LAKE | 405,685 | 0.03 |
| 60. | RLI | 266,558 | 0.02 |
| 61. | AMERICAN FAMILY | 207,369 | 0.02 |
| 62. | MITSUI SUMITOMO | 207,136 | 0.02 |
| 63. | AMICA MUTUAL | 174,040 | 0.01 |
| 64. | AMERICAN ALTERNATIVE | 128,978 | 0.01 |
| 65. | STARSTONE NATIONAL | 124,893 | 0.01 |
| 66. | STATE FARM | 101,847 | 0.01 |
| 67. | GUIDEONE MUTUAL | 63,294 | 0.00 |
| 68. | CUMIS | 61,800 | 0.00 |
| 69. | ALLIED WORLD SPECIALTY | 51,554 | 0.00 |
| 70. | MARKEL AMERICAN | 7,633 | 0.00 |
| Total | 1,329,843,529 | 100.00 |
Agency Checklists’ Proprietary Retrospective of the Commercial Auto Marketplace
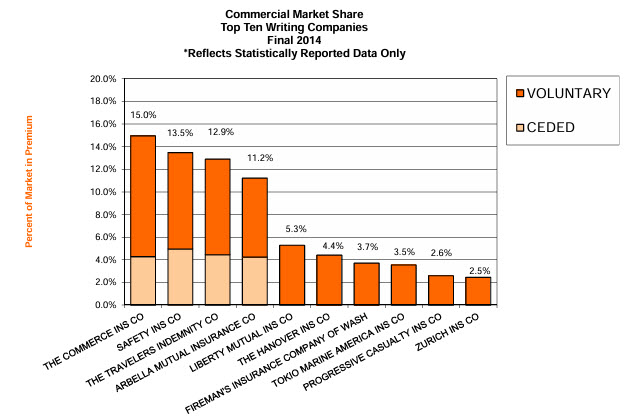
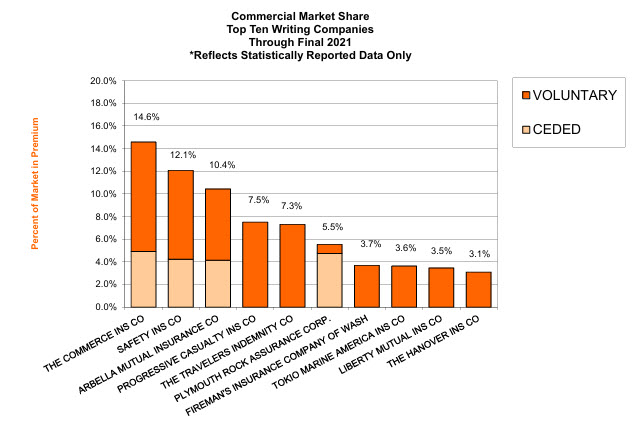
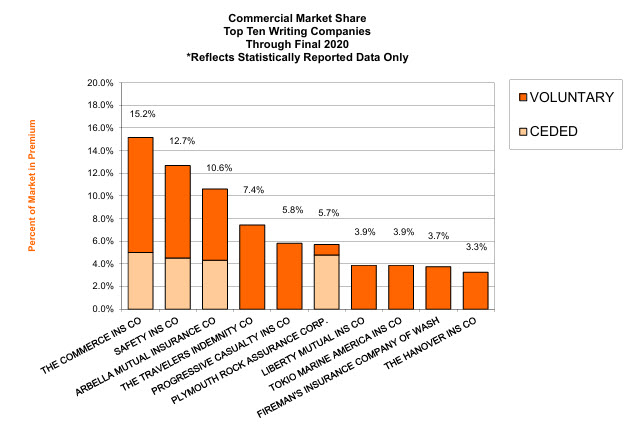
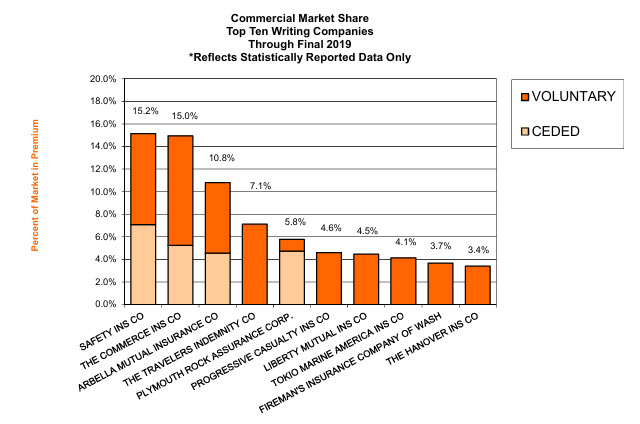
The following are graphs depicting the state of the Commercial Auto Insurance Marketplace over the past 10 years. The first graph shows the top ten Commercial Auto Insurers as of December 2024, compared to Year-End 2023, Year-End 2022, Year-End 2021, and Year-End 2020. Following these comparisons are two more: one from five years ago, Year-End 2019, and the last from ten years ago, Year-End 2014.
Using the sliders, you can compare each year by sliding the window to the left or right on each graph comparison below.
Year-End 2024 v. Year-End 2023


Year-End 2024 v. Year-End 2022


Year-End 2024 v. Year-End 2021
Year-End 2024 v. Year-End 2020
5-Year Comparison
Using the sliders, you can compare each year by sliding the window to the left or right on each graph comparison below.
Year-End 2024 v. Year-End 2023
10-Year Comparison
Using the sliders, you can compare each year by sliding the window to the left or right on each graph comparison below.