

Our latest update on the Commercial Auto Insurance marketplace examines activity during June 2025. As we note in each of our reports, this analysis is based upon data provided by the Commonwealth Automobile Reinsurers (CAR).
For readers who may be unfamiliar with CAR, the authority serves as the official statistical agent for motor vehicle insurance in Massachusetts, collecting and maintaining data for the Commonwealth’s motor vehicle insurance industry
A Look at the Latest Data on Insurer Premiums & Market Share
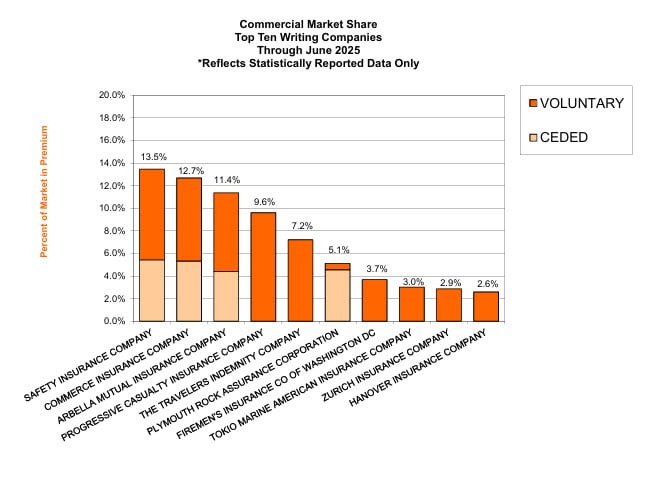
Safety tops the list as the largest commercial insurer so far this year, reporting 93,205,926 in premiums as of June 2025, representing a 13.47% share of the market. It should be noted that typically throughout a year, both Commerce and Safety trade places in the number one spot for the largest share of this marketplace, depending upon which months data is being presented.
With that said, however, the following are the three insurers who appear to have increased their market share the most this month, when comparing insurer data from June 2024 with the latest data from June 2025.
🥇 GEICO
- Premium Increase: +$6,089,201
- Market Share Increase: +0.86 percentage points
- 2025 Premiums: $7,805,782
- 2024 Premiums: $1,716,581
- 2025 Market Share: 1.13%
- 2024 Market Share: 0.27%
- 🚀 Massive growth—GEICO appears to have more than quadrupled its premiums and tripled its market share year-over-year as compared to its 2024 Premiums and Market Share data.
🥈 GREENWICH
- Premium Increase: +$1,157,702
- Market Share Increase: +0.16 percentage points
- 2025 Premiums: $1,515,628
- 2024 Premiums: $357,926
- 2025 Market Share: 0.22%
- 2024 Market Share: 0.06%
- 📈 A strong surge in both premiums and market share, nearly a 4x premium jump.
🥉 LIBERTY MUTUAL INS
- Premium Increase: +$2,572,188
- Market Share Increase: +0.23 percentage points
- 2025 Premiums: $15,391,890
- 2024 Premiums: $12,819,702
- 2025 Market Share: 2.22%
- 2024 Market Share: 1.99%
- 🔥 A solid climb in both metrics, showing consistent upward momentum.
Please note the above is merely to illustrate some of the trends in this marketplace as compared to the same last year. The following is a complete list of market share data for June 2025. Agency Checklists has included the 2024 June Premiums and Market Share data for each insurer to allow our readers to compare this data for themselves.
Commercial Auto Insurers Ranked by Premiums & Market Share as of June 2025
| 🏢 Company | 💰 2025 June Premiums (USD) | 📈 2025 June Market Share (%) | 💰 2024 June Premiums (USD) | 📈 2024 June Market Share (%) |
|---|---|---|---|---|
| SAFETY | 93,205,926 | 13.47% | 84,147,143 | 13.06% |
| COMMERCE | 87,767,215 | 12.68% | 90,429,260 | 14.04% |
| ARBELLA | 78,641,205 | 11.36% | 69,559,588 | 10.80% |
| PROGRESSIVE | 66,427,009 | 9.60% | 63,367,391 | 9.84% |
| TRAVELERS | 49,858,681 | 7.20% | 46,042,294 | 7.15% |
| PLYMOUTH ROCK | 35,390,983 | 5.11% | 31,776,231 | 4.93% |
| FIREMAN’S | 25,434,687 | 3.67% | 23,574,065 | 3.66% |
| TOKIO MARINE & NACHIDO | 20,832,650 | 3.01% | 21,437,187 | 3.33% |
| ZURICH | 19,805,860 | 2.86% | 19,094,477 | 2.96% |
| HANOVER | 17,898,187 | 2.59% | 16,447,800 | 2.55% |
| SELECTIVE INSURANCE | 17,816,198 | 2.57% | 16,498,457 | 2.56% |
| LIBERTY MUTUAL INS | 15,391,890 | 2.22% | 12,819,702 | 1.99% |
| TWIN CITY FIRE INS | 14,694,659 | 2.12% | 12,647,048 | 1.96% |
| UTICA | 12,411,631 | 1.79% | 11,022,171 | 1.71% |
| OLD REPUBLIC | 11,189,623 | 1.62% | 8,452,489 | 1.31% |
| GREEN MOUNTAIN | 9,425,753 | 1.36% | 8,257,612 | 1.28% |
| AMERICAN CASUALTY | 9,239,964 | 1.34% | 7,692,124 | 1.19% |
| FEDERATED MUTUAL | 9,088,440 | 1.31% | 7,512,125 | 1.17% |
| GEICO | 7,805,782 | 1.13% | 1,716,581 | 0.27% |
| FEDERAL | 6,886,885 | 1.00% | 6,131,022 | 0.95% |
| CINCINNATI | 6,301,950 | 0.91% | 5,666,657 | 0.88% |
| CENTRAL MUTUAL INS | 6,026,942 | 0.87% | 5,110,905 | 0.79% |
| GREAT AMERICAN | 5,978,110 | 0.86% | 9,332,167 | 1.45% |
| NEW HAMPSHIRE | 5,659,978 | 0.82% | 4,606,533 | 0.72% |
| FARM FAMILY | 5,648,173 | 0.82% | 5,212,316 | 0.81% |
| N&D MUTUAL | 5,351,143 | 0.77% | 5,043,350 | 0.78% |
| EMPLOYERS MUTUAL | 4,962,850 | 0.72% | 5,184,254 | 0.80% |
| BANKERS | 4,561,329 | 0.66% | 3,955,376 | 0.61% |
| NEW YORK AND GENERAL INS | 4,126,878 | 0.60% | 3,353,782 | 0.52% |
| US FIRE | 4,064,544 | 0.59% | 3,486,871 | 0.54% |
| MIDDLESEX INS CO | 3,652,592 | 0.53% | 3,453,473 | 0.54% |
| ARCH | 3,392,165 | 0.49% | 3,179,156 | 0.49% |
| MERCH MUTUAL | 2,872,714 | 0.42% | 2,697,081 | 0.42% |
| QUINCY MUTUAL | 2,112,109 | 0.31% | 1,922,800 | 0.30% |
| MOBILITAS GENERAL INS. | 1,903,623 | 0.28% | 1,008,034 | 0.16% |
| IMPERIUM | 1,889,627 | 0.27% | 2,076,854 | 0.32% |
| GREENWICH | 1,515,628 | 0.22% | 357,926 | 0.06% |
| MOTORISTS | 1,430,965 | 0.21% | 1,376,969 | 0.21% |
| PREFERRED MUTUAL | 1,351,472 | 0.20% | 1,206,901 | 0.19% |
| SECURITY NATIONAL | 1,285,130 | 0.19% | 691,438 | 0.11% |
| STARR INDEMNITY | 1,179,575 | 0.17% | 879,874 | 0.14% |
| LANCER INSURANCE CO. | 955,619 | 0.14% | 1,165,418 | 0.18% |
| ARGONAUT | 952,307 | 0.14% | 887,807 | 0.14% |
| ATLANTIC SPECIALTY | 718,037 | 0.10% | 836,701 | 0.13% |
| HARLEYSVILLE INS | 672,572 | 0.10% | 775,690 | 0.12% |
| SOMPO AMERICA | 641,300 | 0.09% | 544,302 | 0.08% |
| EVEREST NATIONAL | 620,778 | 0.09% | 584,172 | 0.09% |
| STATE AUTO | 609,296 | 0.09% | 774,703 | 0.12% |
| PENN LUMBERMENS | 535,711 | 0.08% | 377,736 | 0.06% |
| CHURCH MUTUAL | 501,394 | 0.07% | 348,940 | 0.05% |
| QBE | 232,341 | 0.03% | 219,724 | 0.03% |
| AXIS REINSURANCE | 199,198 | 0.03% | 228,363 | 0.04% |
| MITSUI SUMITOMO | 190,751 | 0.03% | 180,352 | 0.03% |
| PENN MNFCT ASSC INS | 188,031 | 0.03% | 149,688 | 0.02% |
| BERKSHIRE HATHAWAY | 142,993 | 0.02% | 124,519 | 0.02% |
| FALLS LAKE | 80,233 | 0.01% | 160,823 | 0.02% |
| AMERICAN AUTOMOBILE | 69,776 | 0.01% | 258,498 | 0.04% |
| AMICA MUTUAL | 64,302 | 0.01% | — | — |
| STATE FARM | 58,225 | 0.01% | 43,949 | 0.01% |
| ALLIED WORLD SPECIALTY | 49,457 | 0.01% | 43,109 | 0.01% |
| RLI | 35,536 | 0.01% | 136,813 | 0.02% |
| AMERICAN ALTERNATIVE | 31,611 | 0.00% | 20,406 | 0.00% |
| CUMIS | 31,087 | 0.00% | 34,004 | 0.01% |
| GUIDEONE MUTUAL | 30,472 | 0.00% | 32,146 | 0.00% |
| AMERICAN FAMILY | 20,637 | 0.00% | 29,561 | 0.00% |
| MARKEL AMERICAN | 11,405 | 0.00% | 1,824 | 0.00% |
| STARSTONE NATIONAL | 882 | 0.00% | 21,358 | 0.00% |
| TOTAL | 692,124,676 | 100.00% | 644,216,833 | 100.00% |
Agency Checklists’ Proprietary Retrospective of the Commercial Auto Marketplace
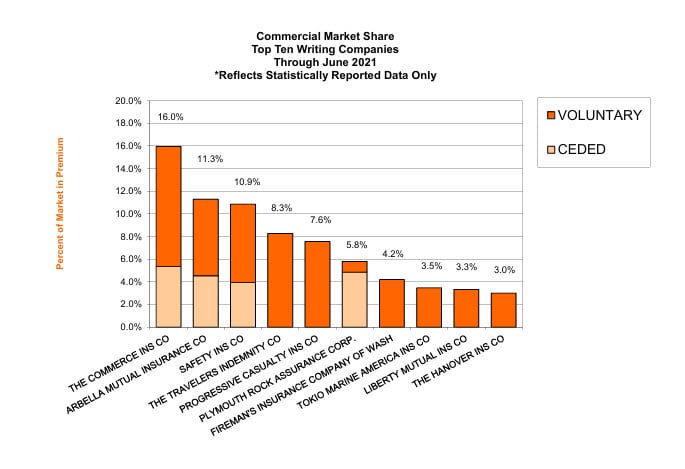
The following are graphs depicting the state of the Commercial Auto Insurance Marketplace over the past 10 years. The first graph shows the top ten Commercial Auto Insurers as of June 2025, compared to June 2024, June 2023, June 2022, and June 2021. Following these comparisons are two more: one from five years ago, June 2020, and the last from ten years ago, June 2015.
Using the sliders, you can compare each year by sliding the window to the left or right on each graph comparison below.
June 2025 v. June 2024

June 2025 v. June 2023


June 2025 v. June 2022

June 2025 v. June 2021
June 2025 v. June 2020

June 2025 v. June 2015
Using the sliders, you can compare each year by sliding the window to the left or right on each graph comparison below.

View all of the other 2025 updates the Auto Insurance Marketplaces in Massachusetts
2025 Private Passenger Auto Insurance Marketplace Updates
- 1st Look 2025: Market Share For MA Auto Marketplace
- 2nd Look 2025: Market Share For MA Auto Marketplace
- 3rd Look 2025: Market Share Report for MA Auto Marketplace
- 4th Look 2025: Market Share Report for MA Auto Marketplace