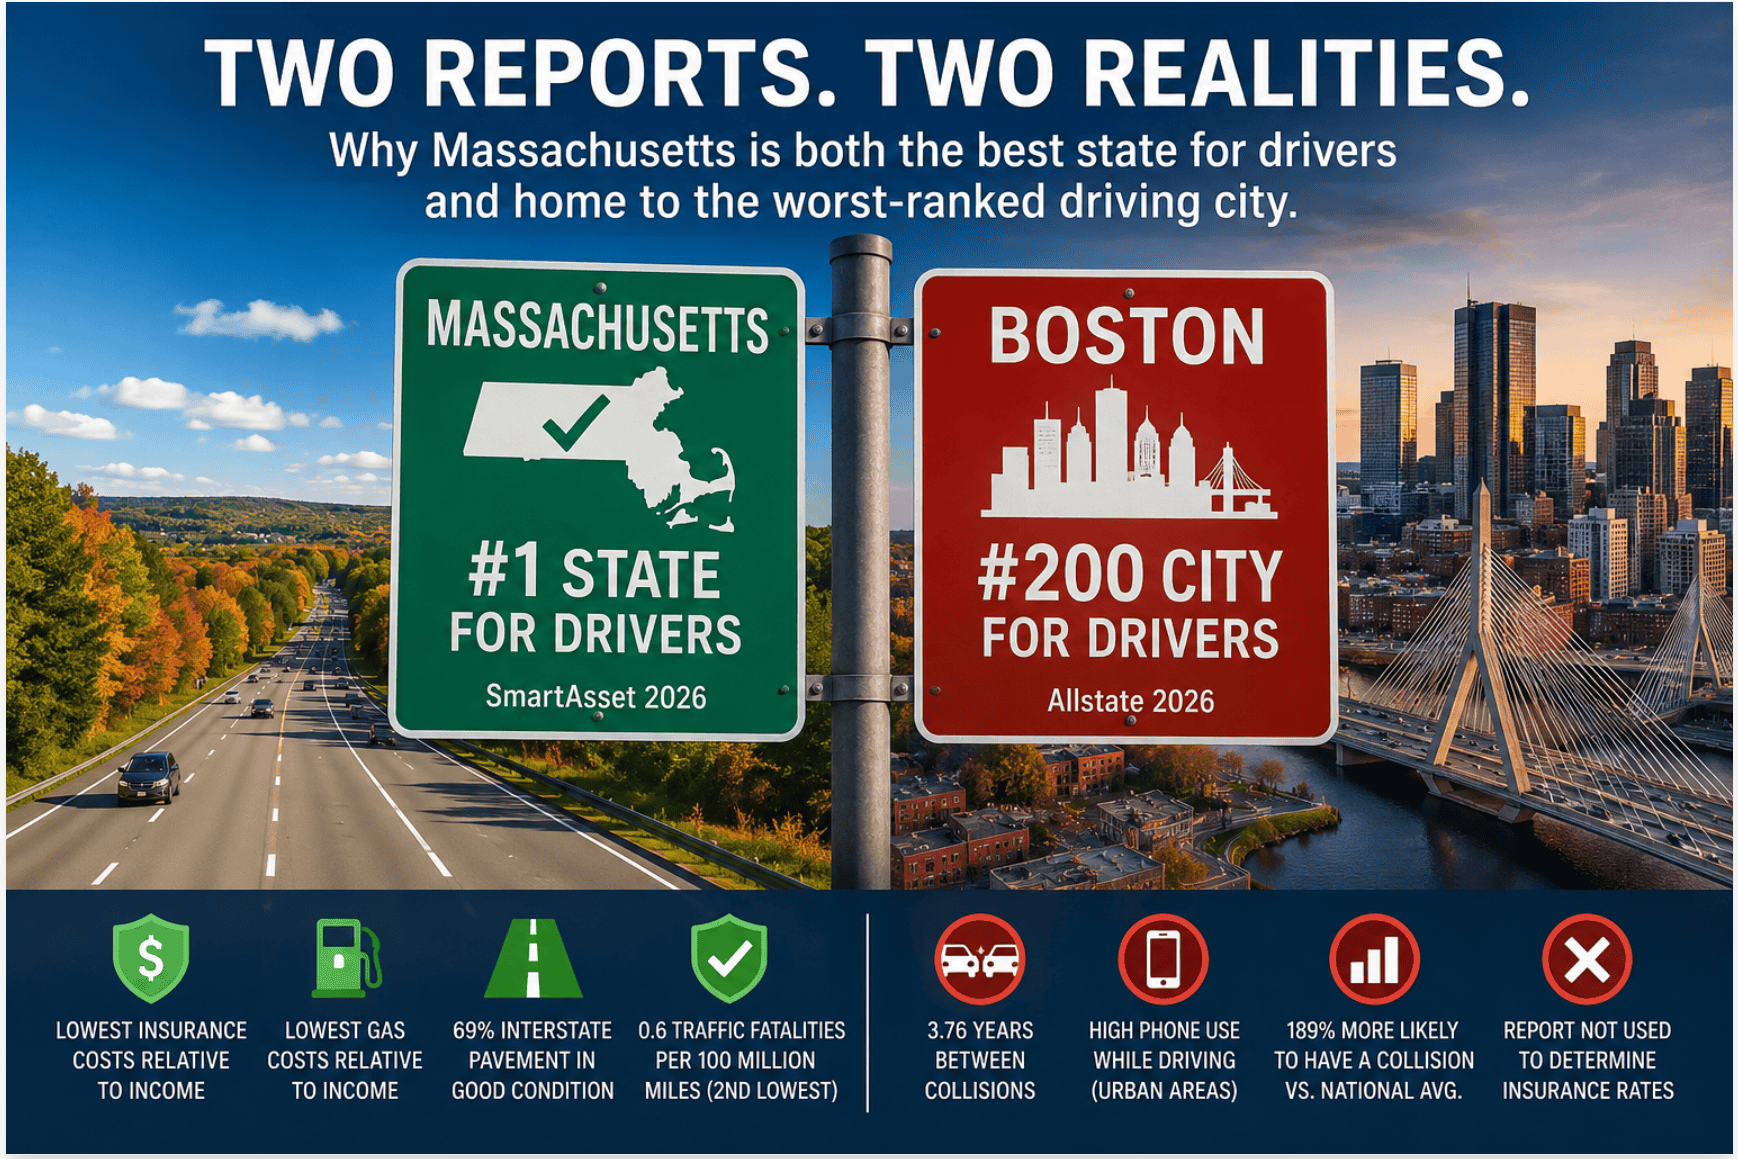
Massachusetts is the best state in the country for drivers, according to one new study. But another 2026 report ranks Boston dead last among the nation’s 200 largest cities for collision frequency.
The seemingly contradictory findings come from two studies measuring very different aspects of driving.
SmartAsset ranked Massachusetts No. 1 in its 2026 Best and Worst States for Drivers study, which considers the cost of auto insurance and gasoline relative to household income, interstate highway conditions and traffic fatalities.
Allstate’s 2026 America’s Best Drivers Report, meanwhile, ranked Boston No. 200 among the nation’s 200 largest cities based on property-damage claim frequency. Worcester and Springfield weren’t far behind, ranking 197th and 196th, respectively. (“AgencyChecklists’ earlier coverage of Allstate’s 2026 America’s Best Drivers Report”)
Taken together, the reports present an unusual picture of driving in Massachusetts: The state scores exceptionally well on highway fatalities and the affordability of driving relative to household income, while its three largest cities rank among the nation’s most collision-prone.
Massachusetts Ranks No. 1 in SmartAsset Study
SmartAsset’s 2026 Best and Worst States for Drivers study ranked Massachusetts first in the country based on four measures: auto insurance premiums relative to household income, gasoline costs relative to income, interstate pavement conditions and traffic fatalities.
- The average auto insurance premium equaled 1.28% of estimated annual household income.
- A 15-gallon tank of regular gasoline equaled 3.08% of estimated weekly household income, tying New Jersey for the lowest percentage nationally.
- 69% of interstate highway pavement was rated in good condition.
- Massachusetts recorded 0.6 traffic fatalities per 100 million vehicle miles traveled, tied with Minnesota for the second-lowest rate behind Rhode Island.
Those results put Massachusetts ahead of New Hampshire, Minnesota, New Jersey and Vermont in SmartAsset’s overall ranking.
There is an important qualification to SmartAsset’s insurance affordability measure. The study uses the latest state-level per-vehicle premium data available from the National Association of Insurance Commissioners and compares those figures with estimated 2026 household income. SmartAsset therefore describes the resulting insurance-to-income percentages as comparative estimates rather than current premium averages.
Allstate Puts Boston Last Among 200 Cities
Allstate reaches a very different conclusion when the focus shifts from statewide driving conditions to collision frequency within individual cities.
Its 2026 America’s Best Drivers Report ranks the 200 largest U.S. cities based on Allstate property-damage claim frequency, expressed as the average number of years between collisions.
Boston ranked No. 200, with drivers averaging just 3.76 years between collisions, compared with the national average of 10.86 years. Allstate reported that Boston drivers were 189% more likely to experience a collision than the national average.
Massachusetts was unusually well represented at the bottom of Allstate’s rankings:
- Boston — No. 200: 3.76 years between collisions
- Worcester — No. 197: 5.14 years
- Springfield — No. 196: 5.18 years
Only Washington, D.C., and Baltimore separated Boston from the other two Massachusetts cities. The Northeast accounted for seven of Allstate’s 10 most collision-prone cities.
Boston Also Ranks High for Phone Use While Driving
Allstate supplemented its claims analysis with aggregated and anonymized data from its Drivewise telematics program, examining phone use, speeding, hard braking and nighttime driving.
Boston was among the major metropolitan areas with the highest levels of phone use while driving, along with Miami, Chicago and Washington, D.C. Allstate said its data showed phone use was more prevalent in dense urban environments.
The distinction between the two Allstate datasets is important. The city rankings themselves are based on property-damage claim frequency — not Drivewise driving behavior. The telematics data provide additional context about driving patterns observed in individual markets.
Why the Two Massachusetts Rankings Aren’t Contradictory
The difference between Massachusetts’ No. 1 SmartAsset ranking and Boston’s No. 200 Allstate ranking largely disappears once the methodologies are compared.
First, the studies examine different geographic areas. SmartAsset evaluates Massachusetts statewide. Allstate evaluates individual cities.
Second, SmartAsset considers the overall economics and environment of driving. Two of its four measures — insurance and gasoline — are evaluated relative to household income. Massachusetts’ comparatively high household incomes therefore affect its ranking.
Allstate’s city rankings don’t consider household income or gasoline costs. They are based on property-damage claim frequency.
Third, and particularly significant for insurance professionals, the studies measure very different aspects of automobile loss experience.
SmartAsset uses traffic fatalities per 100 million vehicle miles traveled as its safety measure. Massachusetts performs exceptionally well by that measure, at 0.6 fatalities per 100 million miles.
Allstate measures property-damage claim frequency. Its rankings reflect how frequently drivers experience collisions resulting in property-damage or collision claims. Allstate analyzed property-damage claims from January 2023 through December 2024 in compiling the 2026 rankings.
A jurisdiction can therefore have a relatively low rate of fatal crashes while simultaneously experiencing comparatively frequent property-damage collisions.
What the Reports Say — And What They Don’t
For Massachusetts insurance professionals, the two studies illustrate why broad rankings of driving safety or affordability require close attention to methodology.
SmartAsset’s No. 1 ranking does not mean Massachusetts drivers have the country’s lowest collision frequency. Its ranking combines affordability, interstate pavement conditions and highway fatality rates.
Likewise, Boston’s last-place Allstate ranking does not establish that Massachusetts has the nation’s most dangerous roads or highest auto insurance costs. It shows that Boston had the highest property-damage claim frequency among the 200 cities included in Allstate’s analysis.
Allstate also expressly states that its America’s Best Drivers Report is not used to determine auto insurance rates.
The result is less a statistical contradiction than a demonstration of how differently driving risk can look depending on what is measured.
Massachusetts can rank as the nation’s best overall state for drivers under SmartAsset’s combination of affordability, infrastructure and highway safety measures while Boston, Worcester and Springfield simultaneously rank among the nation’s most collision-prone cities under Allstate’s property-damage claims measure.