
Highlights from the DOI’s Annual Home Insurance Marketplace Report for Massachusetts
The Massachusetts Division of Insurance issued its Annual Home Insurance Report to the Massachusetts Legislature for calendar year 2024 on December 8, 2025. The report, which reviews the Home Insurance marketplace in Massachusetts shows premium growth alongside continued FAIR Plan expansion, coastal concentration in the residual market, and widespread use of mandatory wind deductibles.
What changed in the Home Insurance Marketplace in Massachusetts in 2024
- The total reported number of home insurance policies declined by 19,808 from 2023 to 2024, driven by a 23,534 decrease in tenant policies (while owners’ policies increased by 4,438).
- Total enrollment in the FAIR Plan increased by 24,436 policies, and the FAIR Plan wrote 8.7% of 2024 home insurance premium.
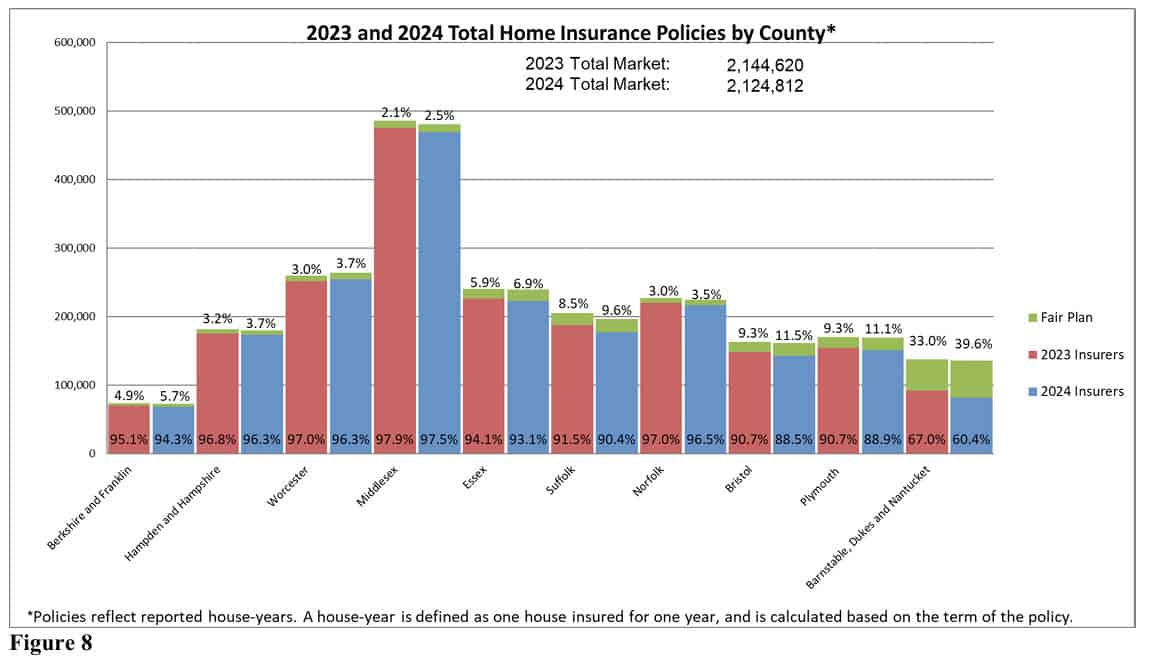
- For the Cape and Islands market, the FAIR Plan accounted for 39.6% of policies.
- The report states there were 7 loss catastrophes in 2024, producing estimated Massachusetts property losses of approximately $157.1 million, consisting primarily of wind and thunderstorm events.
Market Size and Concentration
Approximately 68 licensed insurance carrier groups and 4 individual companies wrote home insurance in Massachusetts in 2024, according to the DOI. Of that group, insurers collected approximately $3.6 billion in written premiums for home insurance policies in Massachusetts in 2024. Interestingly, of the top 10 insurers, only half, or five insurers, offer homeowners insurance nationally, with the other remaining five being insurers offering regional coverage, primarily in the Northeast.
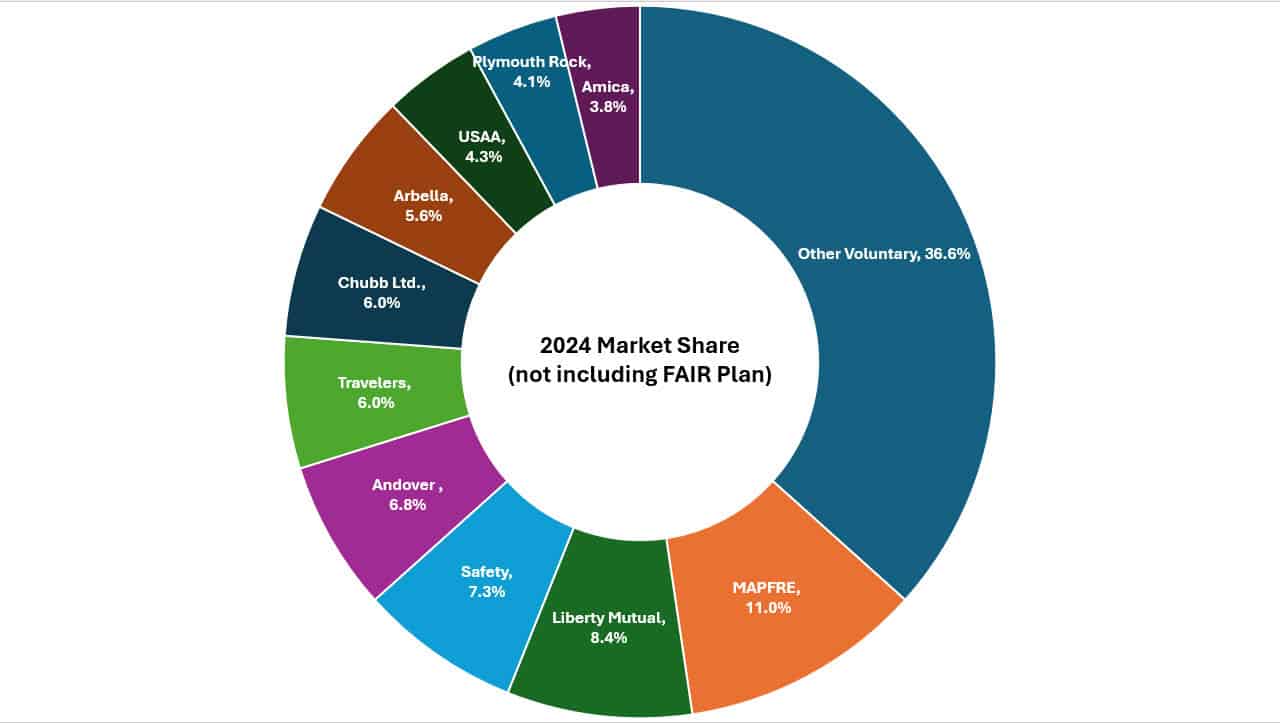
Turning to this group, it accounted for 63.4% of all coverage written by private insurers, excluding the FAIR Plan. Among the voluntary market leaders, Mapfre Insurance Group—parent of Commerce Insurance Company—held the largest voluntary-market share at 11.0% of home insurance premium written. The remaining nine largest insurers all had between 8.4% and 2.8% of hte market. Looking at the top 25 writers of homeowners’ insurance, this group accounted for 92.7% of the non-FAIR-Plan market. The remaining 43 insurers, and thre individual companies outside this group, collectively wrote 7.3% of this marketplace, with none above 0.91% share.
FAIR Plan: growth, coastal concentration, and a 2024 reorganization
On eligibility parameters, the Massachusetts Property Insurance and Underwriting Association (MPIUA), better known as the ‘FAIR Plan’, is required to offer coverage to homes, by statute, with a replacement cost of up to $1 million. Each year, the Annual Home Insurance Report takes a look at the state of the FAIR Plan in the commonwealth.
Beyond year-over-year growth, the report noted the structural change for the residual market. The FAIR Plan was reorganized effective April 4, 2024, as a stand-alone association under an amended constitution and plan of operation. It now operates as a joint underwriting association issuing policies as a direct insurer and accumulating surplus on its own account, with member insurers financially involved only in the event of an assessment.
Overall, the year 2024 saw the FAIR plan account for 8.4% of written premiums, with owner, condominium, and tenant policies increasing by 14, 673 between fiscal years 2023 and 2024. In comparison, the total number of home policies written by insurance companies and the FAIR Plan decreased by 19,808 or 0.92%. The Cape and Islands continued to be the largest market for the FAIR Plan, with it writing 39.6% of the total amount of home policies in the this area.
Wind deductibles: common statewide, higher prevalence in coastal areas
In its discussion of weather-related coverage options, the report states that many home insurance companies amended standard policies to include mandatory wind deductibles, and that (based on information submitted from the FAIR Plan and the top 25 companies) all but four reported mandatory wind deductibles, with deductibles up to 5% of coverage for the main structure.
Across policyholders in coastal or urban areas covered by the FAIR Plan or the top 25 home insurers, the report states 32.6% had a mandatory wind deductible in 2024; in coastal areas, the prevalence was 58.0%, and in urban areas 19.1%.
Flood Insurance
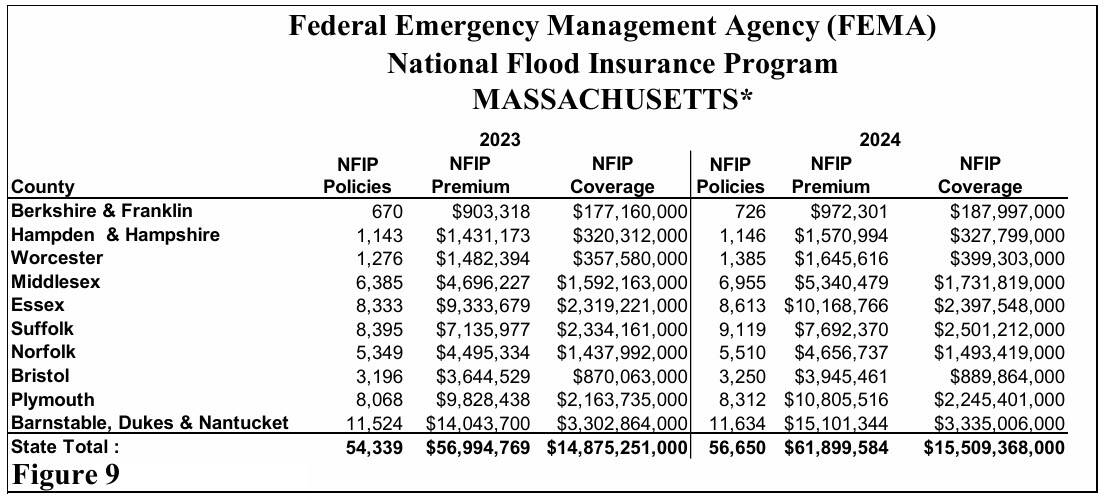
As the 22nd most populous state, the DOI noted that overall Massachusetts homes with flood insurance continues to be “relatively low.’ FEMA reported that approximately 56,650 policyholders in Massachusetts had flood insurance in 2024. This represented an increase of 4.3% from the 2023, when 54,997 reported having flood insurance. The following is a graph from the report highlighting FEMA’s flood insurance statistics for Massachusetts:
Premiums and underwriting metrics: premium growth; lower adjusted combined ratio
Measured on premium paid, the report states Massachusetts insureds purchased approximately $3.9 billion in home insurance coverages in 2024, 12.7% more than 2023; 93.5% of the total was for traditional homeowners’ insurance, and traditional homeowners’ premiums increased by approximately $423.3 million from 2023 to 2024.
On claims experience, the report states the 2024 overall loss ratio across all FAIR Plan and insurance company policies (all residence types) was 31.4%, and that (by form) traditional homeowners’ loss ratio was 31.4%, condominium 33.8%, and tenant 24.1%.
For a broader view of underwriting results including expenses, the report states the market’s adjusted combined ratio was 66.5% for 2024, a decrease from 86.1% in 2023.
The 2024 DOI Home Insurance Report “By the Numbers”
- Policy count (reported): down 19,808 overall; owners up 4,438; tenants down 23,534.
- FAIR Plan: enrollment up 24,436; wrote 8.7% of 2024 premium; 39.6% of Cape and Islands policies.
- Cat activity: 7 loss catastrophes; estimated MA property losses ~$157.1M.
- Market premium: ~$3.6B written premium; ~$3.9B premium paid.
- Concentration (voluntary): top 10 groups 63.4%; top 25 groups 92.7%; largest voluntary share 11.0%.
- Wind deductibles: up to 5% reported; prevalence 32.6% coastal/urban combined, 58.0% coastal, 19.1% urban (FAIR Plan + top 25).
- Underwriting metrics: overall loss ratio 31.4%; adjusted combined ratio 66.5% (vs 86.1% in 2023).
How to view the official report
All data and graphs come courtesy of the Massachusetts Division of Insurance. An official copy of the Report is available on the DOI’s website: Division of Insurance | Mass.gov
A copy of the report is also available below:
