
Massachusetts Commercial Auto Insurance Market Trends – February 2026
Agency Checklists’ latest update on the Massachusetts commercial auto insurance marketplace from CAR reviews activity as of February 2025.
This analysis relies on the most recent data provided by the Commonwealth Automobile Reinsurers (CAR), which serves as the official statistical agent for the state’s motor vehicle insurance industry. CAR collects, maintains, and publishes comprehensive data on insurers operating in Massachusetts, providing a reliable foundation for market analysis.
Premiums & Market Share for Febuary 2026
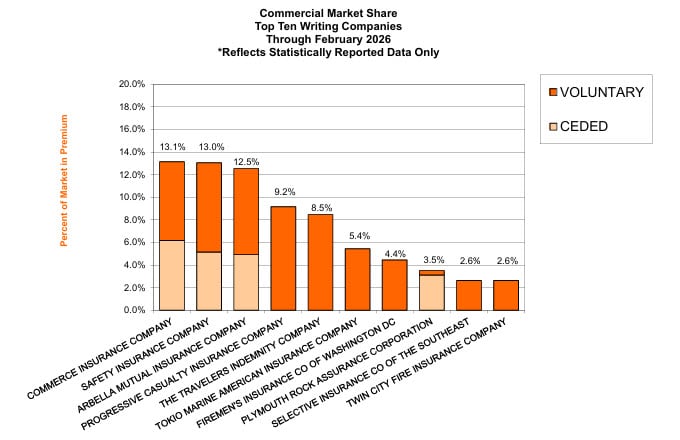
Total commercial auto premiums in Massachusetts as of February 2026 were $233.8 million. Together, the top ten writers accounted for $176.2 million in premiums, representing 75.4% of the market, highlighting the continued concentration of market share among the largest carriers in the second month of the year.
Half of the top 10 commercial auto writers are based in New England, with Safety and Commerce continuing to dominate the marketplace with a combined market share of 26.20%.
🚚 Massachusetts Commercial Auto Insurance Market Share
| Rank | Company | Premiums | Market Share |
|---|---|---|---|
| 1 | COMMERCE | 30,739,868 | 13.15% |
| 2 | SAFETY | 30,500,994 | 13.05% |
| 3 | ARBELLA | 29,286,784 | 12.53% |
| 4 | PROGRESSIVE | 21,413,932 | 9.16% |
| 5 | TRAVELERS | 19,780,140 | 8.46% |
| 6 | TOKIO MARINE & NACHIDO | 12,704,431 | 5.43% |
| 7 | FIREMAN’S | 10,401,481 | 4.45% |
| 8 | PLYMOUTH ROCK | 8,178,003 | 3.50% |
| 9 | SELECTIVE INSURANCE | 6,136,202 | 2.62% |
| 10 | TWIN CITY FIRE INS | 6,124,289 | 2.62% |
| 11 | HANOVER | 5,494,272 | 2.35% |
| 12 | ZURICH | 5,199,989 | 2.22% |
| 13 | AMERICAN CASUALTY | 4,579,338 | 1.96% |
| 14 | GEICO | 4,218,710 | 1.80% |
| 15 | UTICA | 3,522,380 | 1.51% |
| 16 | CENTRAL MUTUAL INS | 2,798,514 | 1.20% |
| 17 | NEW YORK AND GENERAL INS | 2,736,114 | 1.17% |
| 18 | FEDERATED MUTUAL | 2,691,560 | 1.15% |
| 19 | FEDERAL | 2,690,650 | 1.15% |
| 20 | GREEN MOUNTAIN | 2,612,582 | 1.12% |
| 21 | LIBERTY MUTUAL INS | 2,330,174 | 1.00% |
| 22 | ARGONAUT | 2,157,020 | 0.92% |
| 23 | NATIONAL GRANGE | 2,109,767 | 0.90% |
| 24 | N&D MUTUAL | 2,019,627 | 0.86% |
| 25 | NEW HAMPSHIRE | 1,942,382 | 0.83% |
| 26 | MIDDLESEX INS CO | 1,384,436 | 0.59% |
| 27 | US FIRE | 1,212,437 | 0.52% |
| 28 | EMPLOYERS MUTUAL | 1,142,799 | 0.49% |
| 29 | MERCH MUTUAL | 1,086,475 | 0.46% |
| 30 | BANKERS | 1,075,355 | 0.46% |
| 31 | GREENWICH | 897,663 | 0.38% |
| 32 | GREAT AMERICAN | 843,419 | 0.36% |
| 33 | MOTORISTS | 658,836 | 0.28% |
| 34 | QUINCY MUTUAL | 640,817 | 0.27% |
| 35 | PREFERRED MUTUAL | 525,348 | 0.22% |
| 36 | LANCER INSURANCE CO. | 496,071 | 0.21% |
| 37 | STANDARD FIRE | 274,987 | 0.12% |
| 38 | ATLANTIC SPECIALTY | 241,415 | 0.10% |
| 39 | SECURITY NATIONAL | 216,331 | 0.09% |
| 40 | PENN LUMBERMENS | 196,544 | 0.08% |
| 41 | QBE | 157,087 | 0.07% |
| 42 | STATE AUTO | 143,457 | 0.06% |
| 43 | HARLEYSVILLE INS | 113,222 | 0.05% |
| 44 | PENN MNFCT ASSC INS | 64,739 | 0.03% |
| 45 | OLD REPUBLIC | 33,302 | 0.01% |
| 46 | STATE FARM | 13,241 | 0.01% |
| 47 | BERKSHIRE HATHAWAY | 10,801 | 0.00% |
| 48 | AMICA MUTUAL | 9,265 | 0.00% |
| TOTAL | 233,807,250 | 100.00% |
Agency Checklists’ Proprietary Retrospective of the Commercial Auto Marketplace
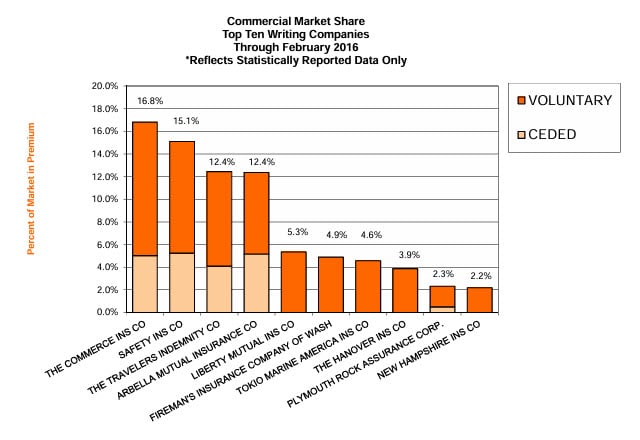
The following are graphs depicting the state of the Commercial Auto Insurance Marketplace over the past 10 years. The first graph shows the top ten Commercial Auto Insurers as of February 2026, compared to February 2025, February 2024, February 2023, and February 2022. Following these comparisons are two more: one from five years ago, February 2021, and the last from ten years ago, February 2016.
February 2026 v. February 2025

February 2026 v. February 2024

February 2026 v. February 2023

February 2026 v. February 2022

February 2026 v. February 2021

10-Year Retrospective
Using the sliders, you can compare each year by sliding the window to the left or right on each graph comparison below.
View Other Recent Updates on the Auto Insurance Marketplaces in Massachusetts
2026 Private Passenger Auto Insurance Marketplace Reports
- 1st Look 2026: Market Share Report for MA Auto Insurance Marketplace
- 2nd Look 2026: Market Share Report for MA Auto Insurance Marketplace
2026 Commercial Auto Insurance Marketplace Reports
- 1st Look 2026: Market Share Report for MA Commercial Auto Insurers
- 2nd Look 2026: Market Share Report for MA Commercial Auto Insurers
2025 Commercial Auto Insurance Marketplace Reports
- 1st Look 2025: Market Share Report for MA Commercial Auto Marketplace
- 2nd Look 2025: Market Share Report for Commercial Auto Marketplace
- 3rd Look 2025: Market Share Report For Commercial Auto Marketplace
- 4th Look 2025: Market Share Report For Commercial Auto Marketplace
- 5th Look 2025: Market Share Report for Commercial Auto Marketplace
